Best 10 Google Pagespeed Tools for enhancing Google Site Performance
Boost your site's speed with the top 10 Google Pagespeed tools. Compare features, get insights, and pick the best performance booster for your website.

Optimising site speed remains critical for businesses aiming to deliver exceptional user experiences and achieve stronger search engine rankings. Even small delays in load time can lead to higher bounce rates and loss of revenue, as shown in studies by Google that highlight a 53% increase in mobile site abandonment if a page takes longer than three seconds to load. This makes site performance not just a technical consideration, but a key factor in business growth and customer satisfaction.
The right set of Google Pagespeed tools helps pinpoint specific performance bottlenecks—from unoptimized images to inefficient JavaScript—and guides targeted improvements. For example, Walmart increased conversions by up to 2% for every one second of improvement in load time, according to their official site speed case study. Improving speed isn't just about technical scores; it has real, measurable impact on user behavior and business outcomes.
In this article, you’ll discover the 10 best Google Pagespeed tools designed to assess, monitor, and accelerate your website. Each tool offers unique features, such as real mobile and desktop performance metrics (like Google PageSpeed Insights), advanced audits (such as Lighthouse), or continuous monitoring (like WebPageTest). We’ll break down how each tool stands out and where it’s most effective, so you can build a clear site improvement strategy and maximize results across all devices.
What is Google Web Page Speed Insights, Google Site Performance, Google Pagespeed Tool?
Efficient website performance is essential for satisfying users and achieving strong search visibility. Google offers several dedicated resources—PageSpeed Insights, site performance evaluation, and a suite of PageSpeed Tools—to help businesses and developers improve their web presence.
Google Web Page Speed Insights
PageSpeed Insights is a free Google utility that analyzes the content of your web pages, providing a speed score and practical suggestions for optimization. It evaluates both mobile and desktop performance, covering metrics like First Contentful Paint and Cumulative Layout Shift.
For example, renowned e-commerce retailer ASOS dramatically reduced their mobile bounce rates by addressing bottlenecks pinpointed by PageSpeed Insights, resulting in a faster, more fluid customer experience.
Google Site Performance
Site performance refers to how swiftly and reliably your website loads and responds to user interaction. This factor significantly influences search rankings and user satisfaction—Google reports show a 53% increase in abandonment if mobile sites take more than three seconds to load.
Major news portals like BBC consistently monitor site speed metrics to maintain engagement, recognizing slow load times can drive readers to competing platforms.
Google Pagespeed Tool
The term "Google Pagespeed Tool" encompasses Google's performance suite, such as PageSpeed Insights and the PageSpeed Module, which together provide diagnostics and actionable fixes for speed issues. These tools automatically highlight improvement opportunities, including image compression and code minification.
Tools like Google's PageSpeed Module are integrated by brands like The Guardian to automate speed enhancements, accelerating both deployment and ongoing maintenance.
Who needs these tools?
Optimizing web performance isn't just for tech giants—it's crucial for organizations large and small. These tools are vital for multiple stakeholders, each with unique use cases.
- Website owners: Even independent bloggers use PageSpeed Insights to enhance SEO and maintain low bounce rates, as frictionless performance grows their readership.
- E-commerce businesses: Online retailers like Wayfair prioritize site speed with Google’s tools, knowing a one-second delay can decrease conversions by up to 7%.
- Developers: Web development teams regularly integrate Google’s performance APIs to catch bottlenecks before they reach production, ensuring stable releases.
- Agencies: Digital marketing agencies managing portfolios for numerous clients use these diagnostics to drive ongoing improvement projects and report ROI through measurable site performance gains.
Indexly
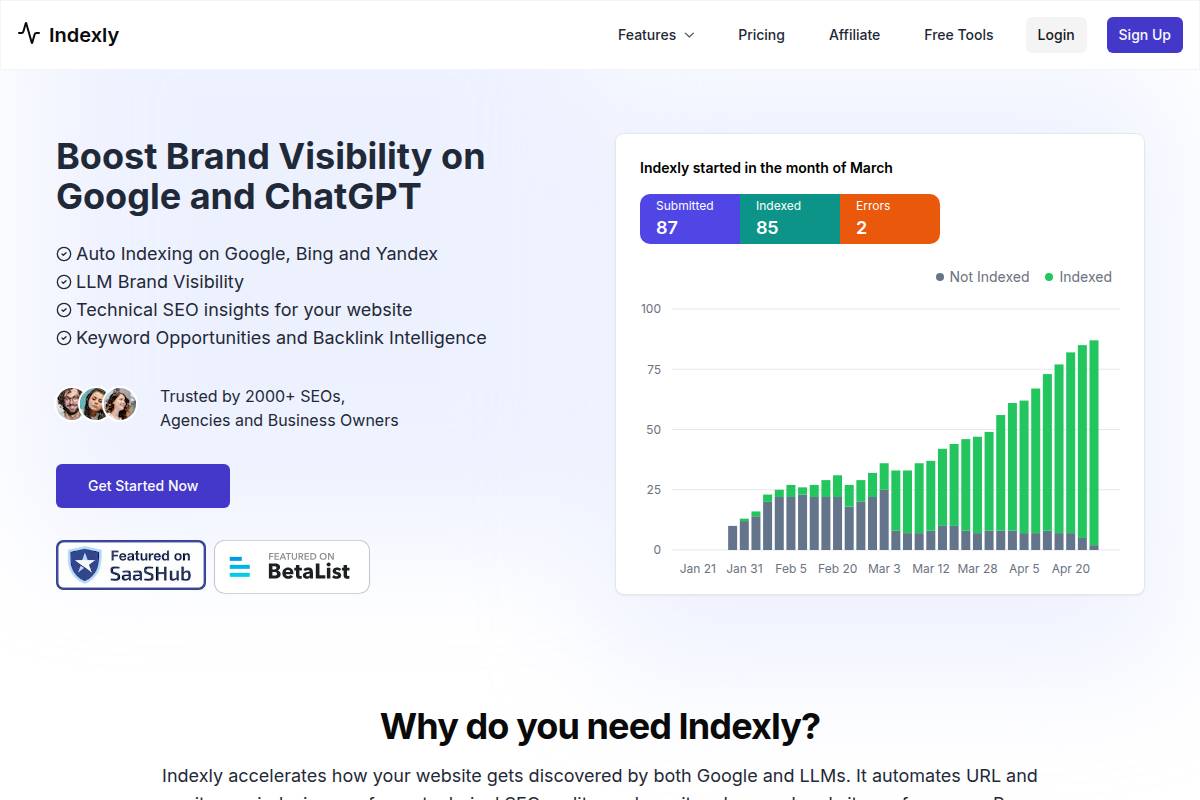
Indexly
Overview
Indexly is a performance monitoring platform tailored for businesses seeking real-time website insights and cross-device testing. It helps digital teams track, visualize, and optimize the performance of their web properties, especially for those managing a global audience.
Retailers like Adidas and media giants such as Bloomberg frequently invest in platforms like Indexly to measure latency and page speed—which directly correlates with conversion rates and user engagement. With built-in analytics and flexible reporting, Indexly has become a fixture for web ops and marketing teams aiming to maintain a competitive edge.
Technical Requirements
Implementing Indexly doesn’t require complex development work on most websites. A standard integration involves adding a JavaScript snippet or API connection, similar to how businesses use services like Google Analytics. Basic web server access rights and permission to update scripts are generally necessary.
For companies running React, Vue, or Angular applications, there may be need for additional adjustments on client-side routing. Large organizations like Walmart typically leverage such integrations as part of a larger toolchain managed by their DevOps teams.
Competitive Positioning
Indexly competes with established players such as WebPageTest, GTmetrix, and Catchpoint. Where it stands out is the breadth of open testing locations and the speed of report delivery. Unlike GTmetrix, which limits location variety on free plans, Indexly's lower-tier offerings provide more geographic reach.
In comparison to SpeedCurve, which is heavily enterprise-focused, Indexly offers a more intuitive dashboard tailored to smaller, agile teams. This positions it well for both mid-size e-commerce brands and digital agencies seeking cost-effective performance analytics.
Getting Started
Getting started begins with signing up, connecting a domain, and launching your first test from the dashboard. The process is user-friendly and doesn’t necessitate specialized training. Comprehensive tooltips and onboarding walkthroughs make it accessible to marketing and product managers alike.
Real-world onboarding examples include SaaS brands like Zapier, which used Indexly to benchmark landing page speed in global markets ahead of product launches. Most users can be up and running in under 30 minutes, with results accessible immediately after setup.
Key Features
Indexly's features provide actionable insights into website performance, making it particularly useful for internationally focused businesses and agencies handling multiple projects.
- Performance testing globally: Run tests from over 30 countries, including hard-to-reach geographies like India and Brazil. Shopify partners often use this to validate store performance in target growth markets.
- Multi-browser support: Indexly conducts tests across Chrome, Firefox, and Safari. This is vital for teams testing complex web apps, as seen with clients such as Booking.com who require browser diversity for accurate analytics.
- Waterfall charts: Granular breakdowns of asset load times help pinpoint bottlenecks. For instance, Redfin uses these charts to spot third-party script slowdowns during promotions.
- Mobile & desktop comparisons: Benchmark and evaluate differences across device types, guiding optimisation for both mobile-first and traditional desktop audiences.
Pros
- Intuitive dashboard: Built for ease of use, multiple users across marketing, development, and management can access and interpret reports without special training or technical jargon.
- Location variety: More test locations than many peers, providing actionable insights for brands expanding to the APAC region or entering Latin America.
Cons
- Free tool is limited: The free tier offers fewer test runs and lacks advanced analytics, similar to constraints in platforms like Pingdom where depth is reserved for paying users.
- Premium plans required for reports: Export and custom report functionality is paywalled, which may frustrate agencies needing frequent executive summaries unless they upgrade.
Pricing
Indexly’s pricing model is tiered, ranging from a limited free plan to flexible monthly subscriptions. Entry plans typically start just under $30/month, targeting startups or small agencies. Larger teams requiring more extensive reporting or integrations may see pricing comparable to competitors such as SpeedCurve, usually in the $200/month range.
As of mid-2023, Indexly hadn’t publicized enterprise-level packages—most inquiries are managed through direct sales consults for custom needs.
User Sentiment
User feedback indicates that Indexly’s ease of use is frequently praised by non-technical staff. Real client reviews on G2 and Capterra highlight the value of location-specific testing and the visually intuitive reporting dashboards.
Reference: Indexly | Best LLM and Google Indexing Tool of 2025
Google PageSpeed Insights
Google PageSpeed Insights
Overview
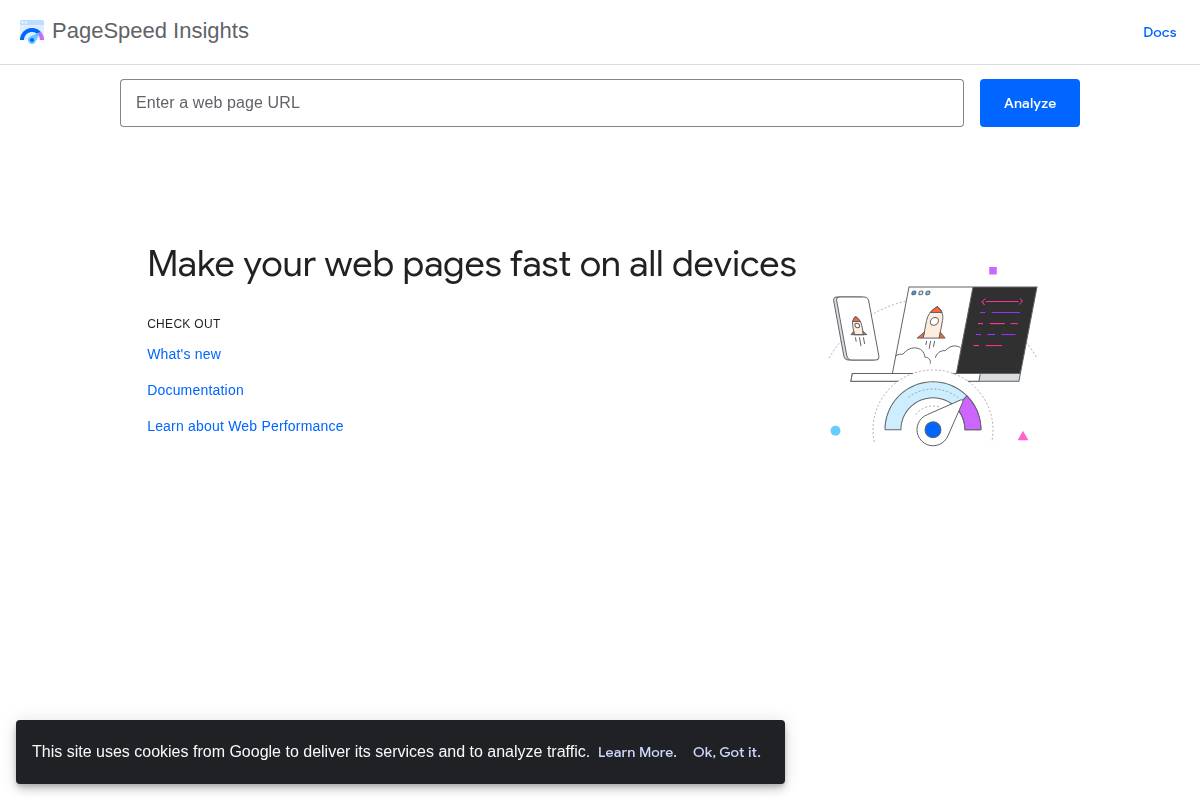
Google PageSpeed Insights is a free online tool designed to analyze the performance of web pages on both mobile and desktop devices. Developed by Google, it provides actionable recommendations to help website owners enhance loading speeds and optimize user experience.
Many digital marketing agencies and e-commerce businesses rely on PageSpeed Insights to measure and benchmark site performance. For instance, Etsy publicly discussed how ongoing speed improvements, guided by such tools, contributed to a measurable uplift in user engagement and conversion rates.
Technical Requirements
The core requirement for using PageSpeed Insights is simply a live URL for analysis—no registration or installation. Results hinge on Google’s Lighthouse automation, which analyzes the URL against set performance metrics.
For best results, ensure that JavaScript and CSS resources are externally accessible, and avoid restricting the tool’s crawler. Some Single Page Applications may require SSR or pre-rendering to ensure all assets are evaluated properly by PageSpeed Insights.
Competitive Positioning
PageSpeed Insights stands out by blending laboratory test results with real user field data, leveraging Chrome UX Report statistics. Unlike GTmetrix, which focuses on synthetic tests and offers deeper historical reporting, Google's tool gives direct integration with its search ecosystem.
While tools like WebPageTest provide advanced customization and scripting for testing, PageSpeed Insights is tailored for straightforward, actionable reporting. This makes it especially popular among site owners seeking quick diagnostics rather than exhaustive custom tests.
Getting Started
Getting started with PageSpeed Insights is straightforward. Visit the PageSpeed Insights homepage, enter your website URL, and click “Analyze.” Results populate quickly with a breakdown of issues and possible fixes.
For businesses managing multiple domains—like news publishers or retail brands—a routine schedule (monthly or quarterly) for running PageSpeed audits is common. Teams often integrate PageSpeed reports into project management tools for ongoing tracking and improvement.
Key Features
PageSpeed Insights' feature set is tailored toward quick, data-driven decision making. Here’s a breakdown:
- Real-time speed analysis: Generate instant reports for any public web URL, reflecting both lab-based scenarios and field-collected user data.
- Mobile and desktop recommendations: Receive tailored advice for each platform; for example, a media site like CNN may get distinct recommendations for its desktop vs. mobile homepage layouts.
- Lab and field data reports: Access metrics from Lighthouse as well as aggregated Chrome user data, revealing patterns like First Contentful Paint and Time to Interactive.
- Opportunity and diagnostics sections: The "Opportunities" tab pinpoints what site elements to optimize, such as image compression, which Dropbox credited as a quick-win for reducing load times by 30%.
Pros
- Free to use for unlimited websites and reports, making it accessible even for startup teams and small business owners.
- Seamless integration with the Google ecosystem, which aids digital marketers in correlating site speed with organic search performance (e.g., through Search Console).
Cons
- Limited historical tracking—users can’t visualize past performance trends unless they manually export and archive results.
- No advanced customization or scripted testing, which means enterprise teams may still need supplementary tools like WebPageTest or GTmetrix for complex scenarios.
Pricing
Google PageSpeed Insights is completely free. There are no hidden fees or premium tiers. This pricing structure removes cost barriers for nonprofits, educational institutions, and small businesses seeking to improve web performance.
User Sentiment
User sentiment for PageSpeed Insights is generally positive, especially among developers and SEO professionals. On platforms like Reddit’s r/webdev and Twitter, many highlight its simplicity and direct integration with Google’s guidelines as primary benefits.
Some advanced users, on the other hand, express a desire for more granular controls and deeper reporting, emphasizing a gap where competitors such as WebPageTest hold an edge.
Reference: PageSpeed Insights
GTmetrix
GTmetrix
Overview
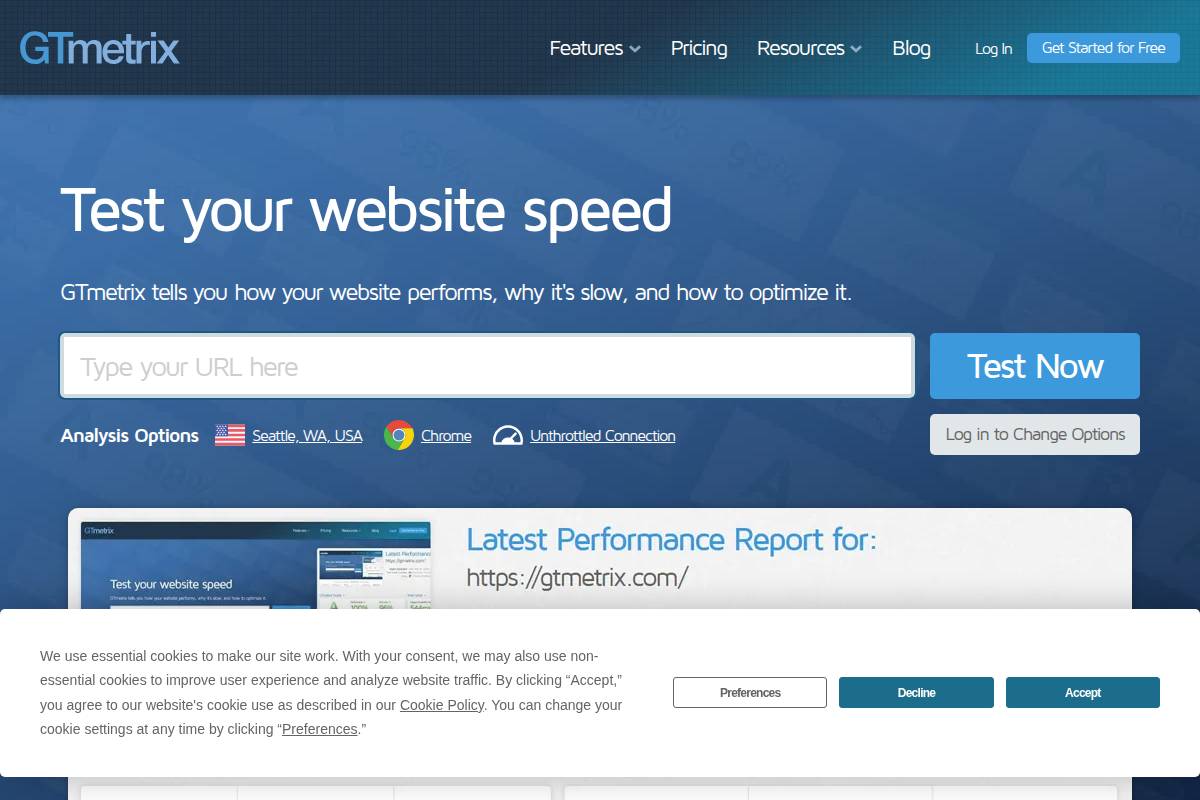
GTmetrix has built a reputation as a robust website performance testing tool, popular among developers and digital marketers who need actionable insights to improve loading speeds. It’s often cited in industry roundups such as 10 Best Website Speed Test Tools in 2025 (Tried & Tested) due to its comprehensive analytics and customizable test environments.
This tool helps users pinpoint specific bottlenecks by simulating page loads from various global locations and across multiple devices. Such insights have been leveraged by agencies managing high-traffic sites like Shopify stores and popular WordPress blogs.
Technical Requirements
GTmetrix is entirely web-based, requiring only a modern browser for access—no software installation is needed. For advanced features, users must register for a free account, which unlocks options like test server selection and mobile simulation.
Businesses focused on continuous monitoring can utilize the GTmetrix API, suitable for integration into custom dashboards or QA pipelines. Some enterprises pair GTmetrix with tools like Jenkins for automated performance regression testing, ensuring their web assets remain fast post-deployment.
Competitive Positioning
While Google PageSpeed Insights offers core web vitals, GTmetrix excels in detailed waterfall visualizations and practical guidance. Its direct competitors include Pingdom and WebPageTest, but GTmetrix stands out for combining real-world performance grades with detailed structural analysis.
According to industry roundups, development teams often select GTmetrix specifically for clients needing granular, visually rich diagnostics. Brands like Moz and Sephora Canada have mentioned using GTmetrix reports in site optimization sprints.
Getting Started
New users can start by entering a website URL on GTmetrix’s homepage to generate an instant report. Creating a free account unlocks features like selection of test locations and historical data tracking.
Organizations with complex requirements often leverage GTmetrix Pro for scheduled testing and longer retention of reports, enabling ongoing optimization efforts. For instance, consulting agencies use scheduled reports to provide monthly performance audits for e-commerce clients.
Key Features
GTmetrix offers advanced capabilities that support thorough site analysis. These features help both technical and non-technical teams identify and address speed issues efficiently.
- Detailed waterfall reports: Examine resource load order and timings for scripts, images, and stylesheets. For example, a media site like TechCrunch has used GTmetrix’s waterfall view to discover third-party scripts causing slowdowns.
- Performance and structure scores: Get clear grades based on Lighthouse and proprietary algorithms, guiding targeted improvements. Businesses have cited achieving score increases of 10-20% after addressing flagged issues.
- Historical performance data: Track changes over time, ideal for teams running regular A/B tests. For example, WooCommerce store owners have monitored page load progress after switching themes.
- Various test locations: Choose from over 30 global test servers, so international brands like Booking.com can evaluate user experience across continents.
Pros
- Visual reports: Clear charts and visualizations make it easy for teams to communicate performance bottlenecks to stakeholders.
- Multiple test settings: Adjust device, bandwidth, and location settings for comprehensive diagnostics.
Cons
- Limited free plan: The free version restricts test locations and number of saved reports, which can be limiting for agencies managing several sites.
- May overwhelm beginners: The abundance of technical details and advanced options may be daunting for those new to site optimization.
Pricing
GTmetrix offers a free basic tier, but most businesses and agencies benefit from Pro plans, which start around $10 per month. Higher tiers add features such as increased test frequency, additional test locations, and priority support.
For volume users, enterprise packages can be negotiated, supporting hundreds of monitored URLs. Detailed plans are outlined on the GTmetrix pricing page, tailored for organizations with specific workflow needs.
User Sentiment
GTmetrix consistently receives positive feedback from users who require actionable, clear insights. Developers on platforms like Stack Overflow frequently recommend it for diagnosing sluggish sites, citing its depth compared to more basic tools.
Some users mention that the learning curve can be sharp for newcomers, particularly when interpreting waterfall details—but the richness of data outweighs the complexity for teams focused on continuous performance improvement.
Reference: GTmetrix | Website Performance Testing and Monitoring
Pingdom Tools
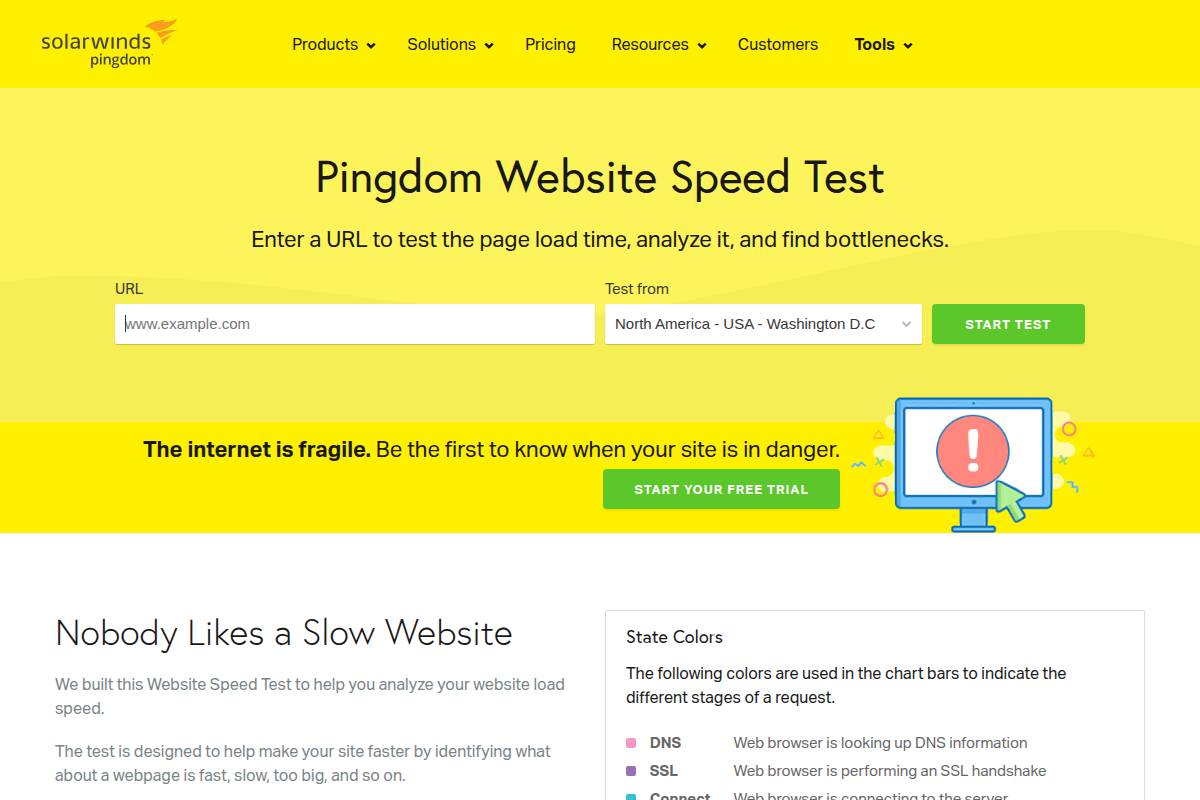
Pingdom Tools
Overview
Pingdom Tools is a widely-used performance monitoring suite by SolarWinds, tailored for website owners, developers, and digital agencies seeking to optimize website speed and reliability. The platform has established itself as a trusted name for real-time synthetic monitoring, thanks to its intuitive interface and actionable site diagnostics.
Brands like Pinterest and Dell have relied on Pingdom to track their website’s health, drawing from its detailed reports to maintain rapid load times and high user satisfaction even during substantial spikes in visitor traffic.
Technical Requirements
Pingdom operates entirely via the cloud, requiring only a modern web browser. There’s no need for software installation or server-side scripts, which makes adoption straightforward for companies of any size.
For example, marketing teams at Shopify can use Pingdom’s dashboard on Chrome, Firefox, or Safari to monitor e-commerce uptime without IT involvement or backend integration complexities.
Competitive Positioning
Pingdom competes with tools like GTmetrix and Google PageSpeed Insights, each serving distinct user bases. Its global network of test servers gives it an edge in simulating real user locations, which can provide more meaningful international performance insights compared to rivals that focus on North American or European traffic.
In head-to-head comparisons, Pingdom is often favored for its user interface but noted for fewer advanced diagnostic features than developer-focused platforms such as WebPageTest.
Getting Started
Onboarding with Pingdom is direct: users simply enter a website URL into the online interface. There’s no code to embed or dependencies to manage during setup. For instance, a digital marketing agency testing a new client’s campaign landing page can access baseline results in seconds, allowing rapid iteration.
Pingdom offers a 14-day free trial, making it accessible for short-term performance audits or pilot programs before a long-term commitment.
Key Features
Pingdom’s standout capabilities have been instrumental for organizations managing large, mission-critical websites.
- Webpage speed testing: Tests assess page load times from multiple global locations—helping brands like IKEA fine-tune their digital storefronts for cross-border audiences.
- Uptime monitoring: 24/7 uptime checks trigger instant alerts if a site goes down, a feature leveraged by SaaS providers such as Zendesk to ensure servicelevel agreements are met.
- Performance grades: Assigns actionable scores, detailing how factors like image optimization or script minification impact user experience, with remediation tips for development teams.
- Asset breakdown: Visualizes how individual scripts, stylesheets, and images contribute to load time, letting website managers understand which third-party assets may cause bottlenecks.
Pros
- User-friendly interface: The clear layout with color-coded charts appeals to users without technical backgrounds—for example, content marketers at Forbes can review performance without involving IT.
- Global test servers: Network coverage spans dozens of cities worldwide, allowing for truly representative testing for brands with international user bases, such as H&M or Spotify.
Cons
- Limited free data: The free version offers only a small number of tests per month, restricting access for users running multiple sites or needing continuous analysis. Power users quickly outgrow these constraints.
- Less technical details than some rivals: Advanced developers seeking low-level waterfall breakdowns or root-cause analysis may find tools like WebPageTest or Google Lighthouse more informative for granular troubleshooting.
Pricing
Pingdom operates on a subscription basis, with tiers based on the frequency of monitoring and number of checks. Plans start around $10 per month, scaling up for enterprise-grade needs. For example, digital agencies managing multiple client domains may choose packages with hundreds of checks and advanced alerting.
No permanent free tier is offered, though the trial period provides ample opportunity for hands-on evaluation before purchase.
User Sentiment
User reviews on platforms like Trustpilot and G2 consistently praise Pingdom’s reliability and fast setup. Common themes include appreciation for its notification system and clarity of reporting, which makes it a favorite among businesses lacking dedicated IT resources.
Some reviews note that advanced power users may supplement Pingdom with more technical diagnostics to achieve highly granular insights during troubleshooting.
Reference: Website Speed Test | Pingdom Tools
WebPageTest

WebPageTest
Overview
WebPageTest is a widely recognized tool designed to assess web performance from multiple global locations using different browsers and devices. Built originally by Patrick Meenan while at AOL, the platform has evolved into a reputable standard for in-depth page speed diagnostics. Organizations and individual developers alike rely on WebPageTest to measure real user experiences and pinpoint website bottlenecks.
Major news outlets like the BBC and e-commerce sites such as Walmart have used WebPageTest to optimize their load times and Core Web Vitals. Its comprehensive reporting dashboard allows for granular analysis of resource loading and rendering processes.
Technical Requirements
Running WebPageTest requires only an internet connection and a modern browser. For those wishing to self-host, technical setup entails configuring a server (Windows, Mac, or Linux), setting up agent connections, and managing updates—a process requiring basic IT skills.
Some advanced features, such as scripting and 3rd-party API integrations, are easier to access with familiarity in web development and automation tools. Large teams often integrate WebPageTest results into CI/CD pipelines using REST API for ongoing test automation.
Competitive Positioning
WebPageTest stands out against competitors like GTmetrix and Pingdom by offering granular visualizations—such as filmstrips and request waterfalls—that go beyond basic performance scores. Its open-source model appeals to organizations wanting transparency and customizability.
However, platforms like Google PageSpeed Insights provide sleek, less technical user experiences and easy-to-understand guidance, which appeals to less technical users. Enterprise tools such as SpeedCurve and Catchpoint build on WebPageTest results but add project-wide monitoring and alerting capabilities.
Getting Started
To get started, users navigate to the WebPageTest website, enter a URL, select from browser and location options, and initiate the test. Results are typically ready within a few minutes and present detailed waterfall charts, filmstrips, and performance metrics.
For teams working on continuous improvement, WebPageTest documentation offers practical guides for setting up automated testing scripts, integrating with Slack notifications, and embedding results into dashboards via API.
Key Features
- Multi-browser, multi-location testing: Test web pages across browsers like Chrome, Firefox, and Safari and in global locations (e.g., New York, London, Mumbai).
- Filmstrip view: See visual step-by-step loading progress at 0.1 second intervals; for example, Pinterest engineering teams use this feature to spot layout shifts.
- Advanced network throttling: Simulate connections from dial-up to 4G to replicate real-world user experiences. Google has recommended network throttling to emulate true mobile conditions during audits.
- Core Web Vitals reporting: Get detailed scores and suggested fixes for Largest Contentful Paint (LCP), Cumulative Layout Shift (CLS), and First Input Delay (FID).
Pros
- In-depth diagnostics: Provides detailed resource breakdowns, filmstrips, and request waterall analyses leveraged by publishers like The Guardian for fine-tuned optimizations.
- Open source: Enables self-hosting, customization, and programmatic integration for larger development teams or for compliance needs.
Cons
- Technical UI: The interface can be overwhelming for beginners, as advanced metrics and charts often require web performance literacy.
- Slower processing times: Public test queues can result in delays, especially during peak hours—users sometimes wait several minutes for a test to complete compared to near-instant results from PageSpeed Insights.
Pricing
WebPageTest offers both free and paid tiers. The free version allows unlimited testing with standard features, but with limited test priority. Paid subscriptions start at around $15 per month, offering priority queues, advanced scripting, and increased test runs for businesses needing regular and large-scale testing.
Nonprofits and open-source projects can apply for sponsorships or higher usage limits by contacting their support team, as seen with several major university research projects.
User Sentiment
Feedback from developers and site owners is generally positive, praising the depth of analysis and transparency. A 2023 survey by Smashing Magazine reported over 70% of respondents viewed WebPageTest as their primary web performance analysis tool.
Less technical users occasionally cite confusion with result interpretation, suggesting room for UI simplification. Nonetheless, performance engineers and SEO professionals frequently recommend WebPageTest for serious optimization efforts.
Reference: WebPageTest
Lighthouse
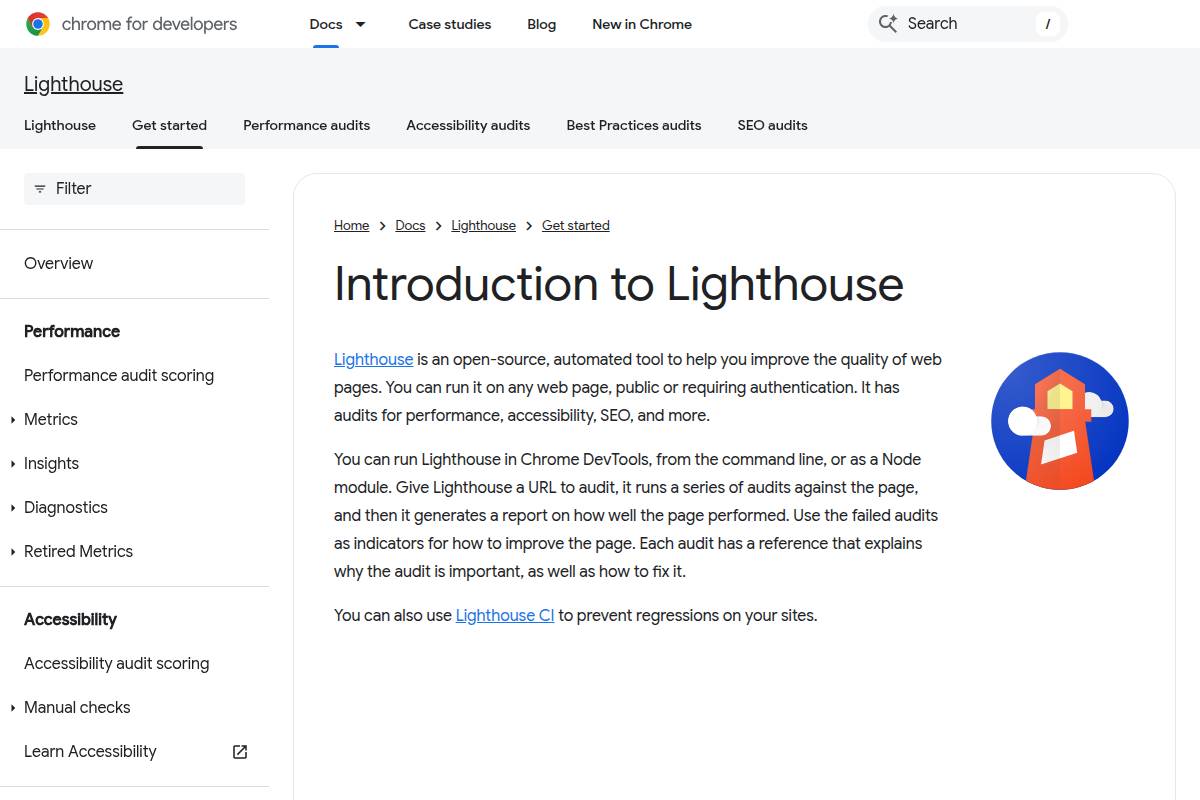
Lighthouse
Overview
Lighthouse is a widely-used, open-source tool developed by Google for evaluating website quality across performance, accessibility, SEO, and more. It's especially recognized for its robust audits and deep diagnostic capabilities.
This tool is commonly leveraged by web developers, marketers, and SEO professionals who want to benchmark and improve their site's technical health. Prominent online publishers like Smashing Magazine and eCommerce giants such as Walmart have utilized Lighthouse to pinpoint bottlenecks impacting user experience.
Technical Requirements
Lighthouse can be accessed as a Chrome browser extension, within Chrome DevTools, or from the command line. Users need to have the latest version of Google Chrome, as Lighthouse is tightly integrated into this ecosystem.
Teams automating audits in a CI/CD pipeline often install Lighthouse via npm. However, this process requires familiarity with Node.js and CLI environments, making it less approachable for those without technical backgrounds.
Competitive Positioning
Compared to other tools like GTmetrix or WebPageTest, Lighthouse uniquely emphasizes accessibility and SEO in addition to speed. For example, Shopify's internal teams frequently use Lighthouse to monitor these multi-faceted dimensions and prioritize fixes for each site launch.
Its open-source model also allows for more customization, with some digital agencies creating bespoke Lighthouse plugins to meet niche client requirements—a flexibility not easily matched by closed SaaS alternatives.
Getting Started
Launching a Lighthouse audit can be as simple as opening Chrome DevTools, clicking the “Lighthouse” tab, and running the test. Many digital marketing teams at agencies like Merkle rely on this workflow for quick audits during site reviews.
For automated workflows, installing Lighthouse via npm in a CI environment allows continuous auditing with every code deployment. Google provides clear documentation for setup and integration within popular CI tools like Jenkins or GitHub Actions.
Key Features
Lighthouse stands out for its suite of technical features that diagnose and suggest improvements:
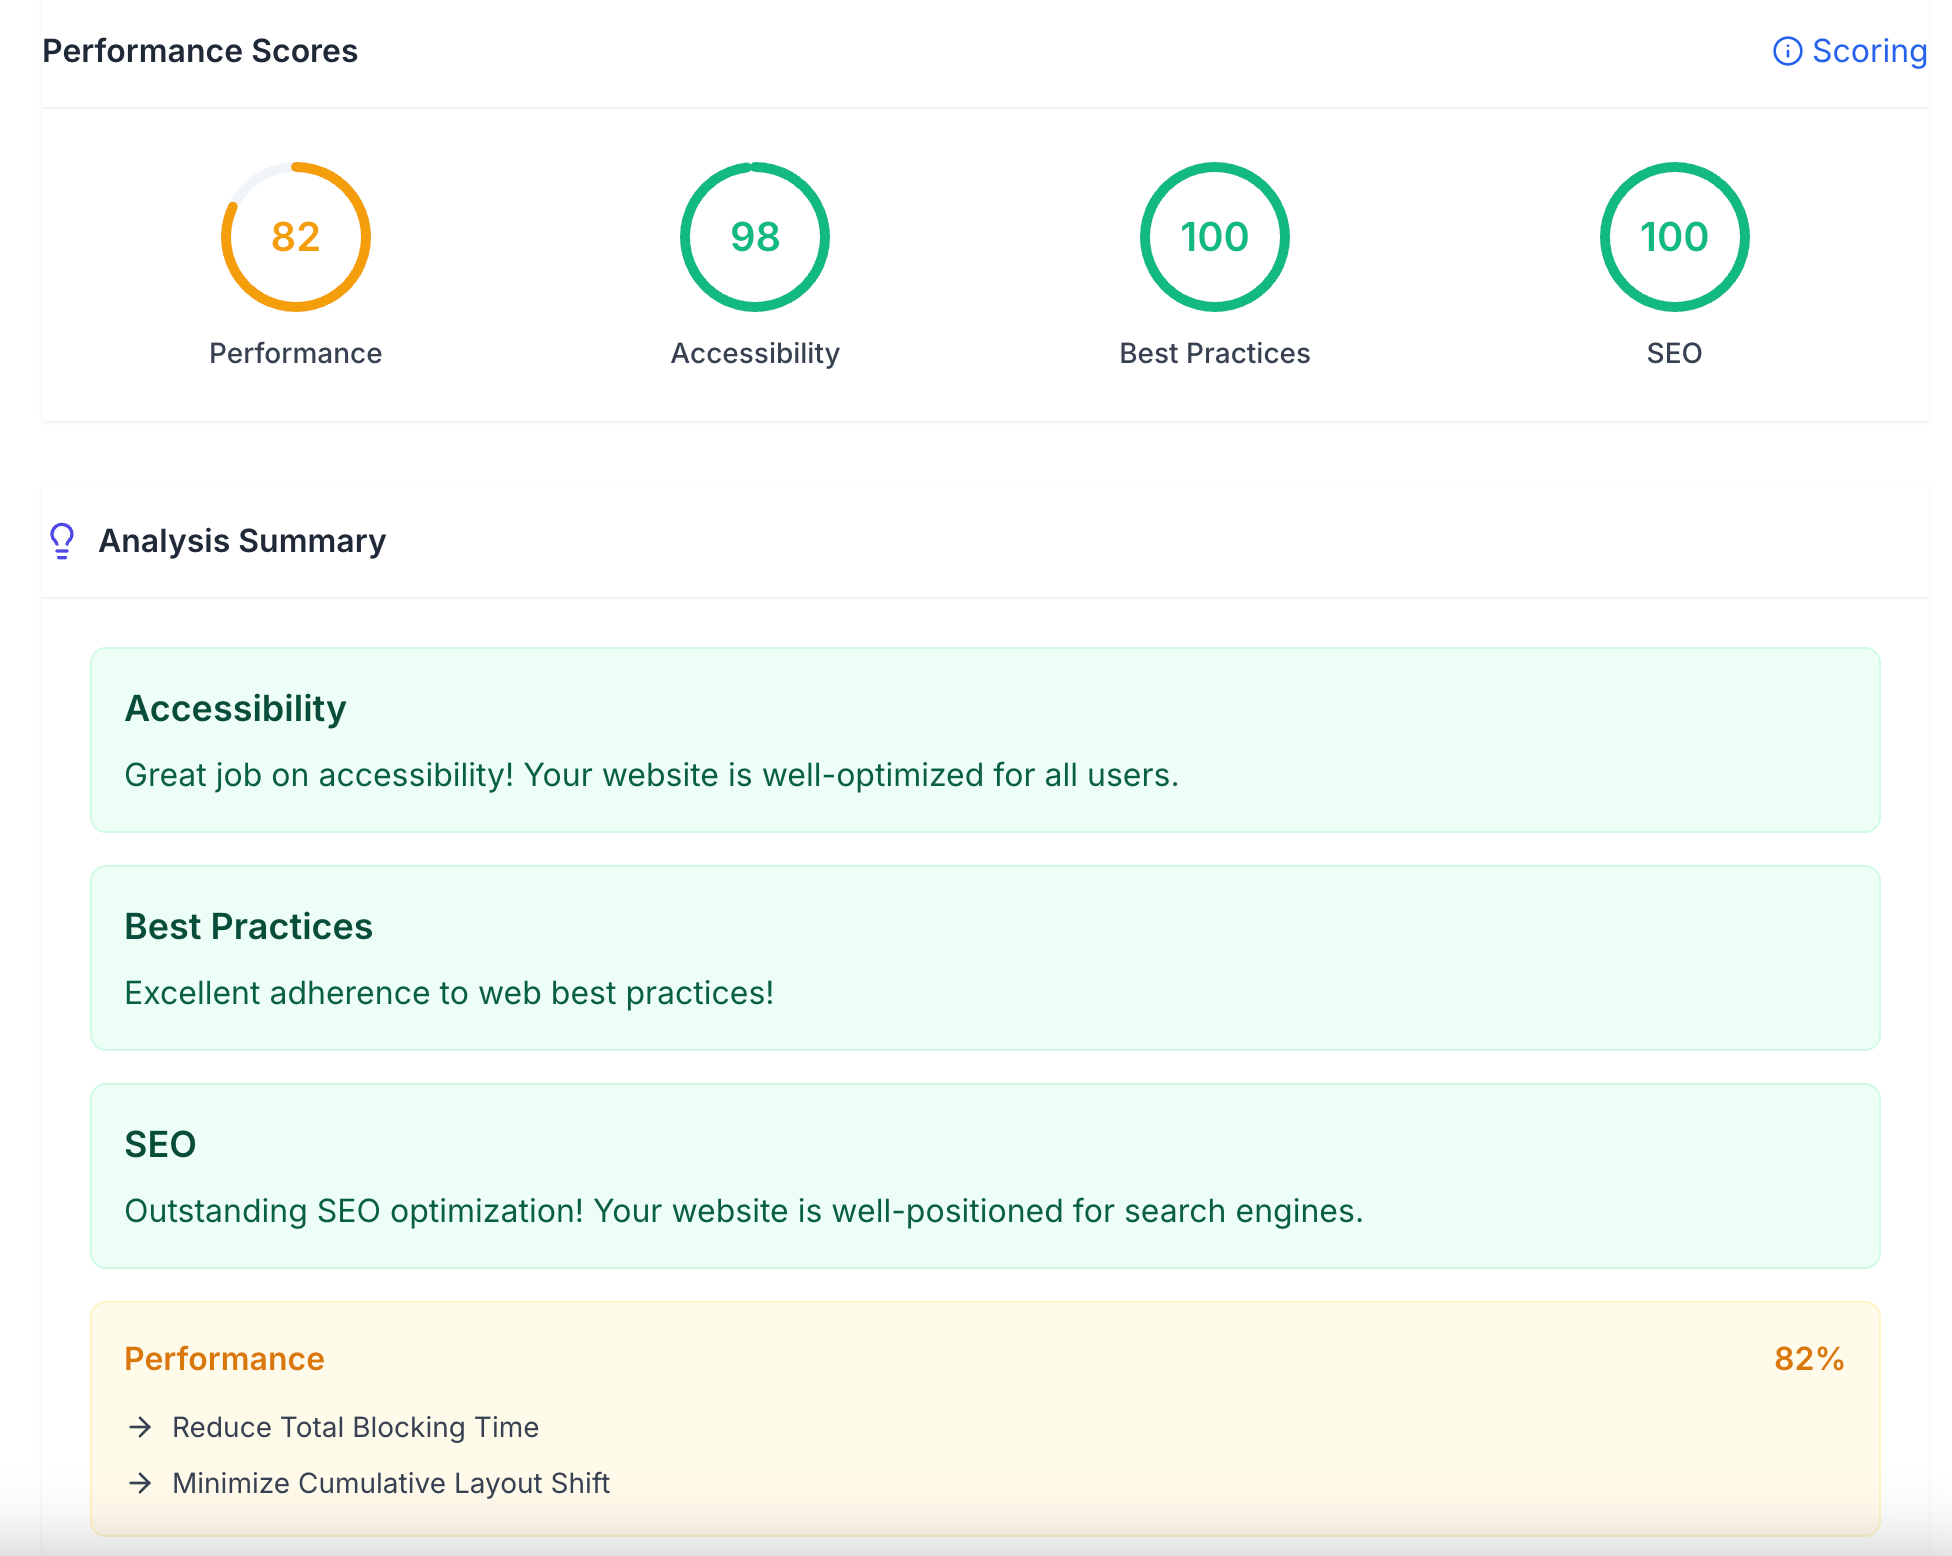
- Chrome DevTools integration: Instant access within Chrome simplifies workflow for developers analyzing issues on live websites.
- Audits for performance, accessibility, SEO: Each audit offers granular metrics—it can analyze Largest Contentful Paint for speed, color contrast for accessibility, and meta tag presence for SEO, mirroring Google's search ranking standards.
- Scoring system: Each category receives a weighted, color-coded score for easy benchmarking and progress tracking. For instance, BBC News used Lighthouse scores to drive site improvements, publishing results in performance reports.
- Specific recommendations: Actionable advice is provided for every issue detected, guiding even seasoned teams toward the most impactful fixes, such as reducing JavaScript bundle sizes or adding ARIA labels.
Pros
- Open source: Free to use and highly customizable, with a global community contributing updates and plugins
- Comprehensive audit range: Covers not only speed but also accessibility and SEO, enabling multifaceted site optimization
Cons
- Requires Chrome: Not directly accessible from other browsers or without installing Chrome, which can be restrictive for some organizations
- Not beginner-friendly: Technical setup—especially for custom or automated runs—can pose challenges for non-technical users
Pricing
Lighthouse is completely free and open source. Google maintains its core development, ensuring regular updates with evolving web standards. Unlike commercial website audit tools that may charge $50 to $200 per month (such as Sitebulb or Screaming Frog), Lighthouse eliminates ongoing licensing costs.
User Sentiment
User reviews across platforms like GitHub and Stack Overflow consistently praise Lighthouse for its depth and accuracy. Google's support and frequent updates bolster its reputation in the developer community.
Some users, particularly less technical ones, cite a steep learning curve for advanced integrations or interpreting complex reports. Overall, professionals appreciate its actionable insights and transparent scoring.
Reference: Introduction to Lighthouse - Chrome for Developers
Dareboost
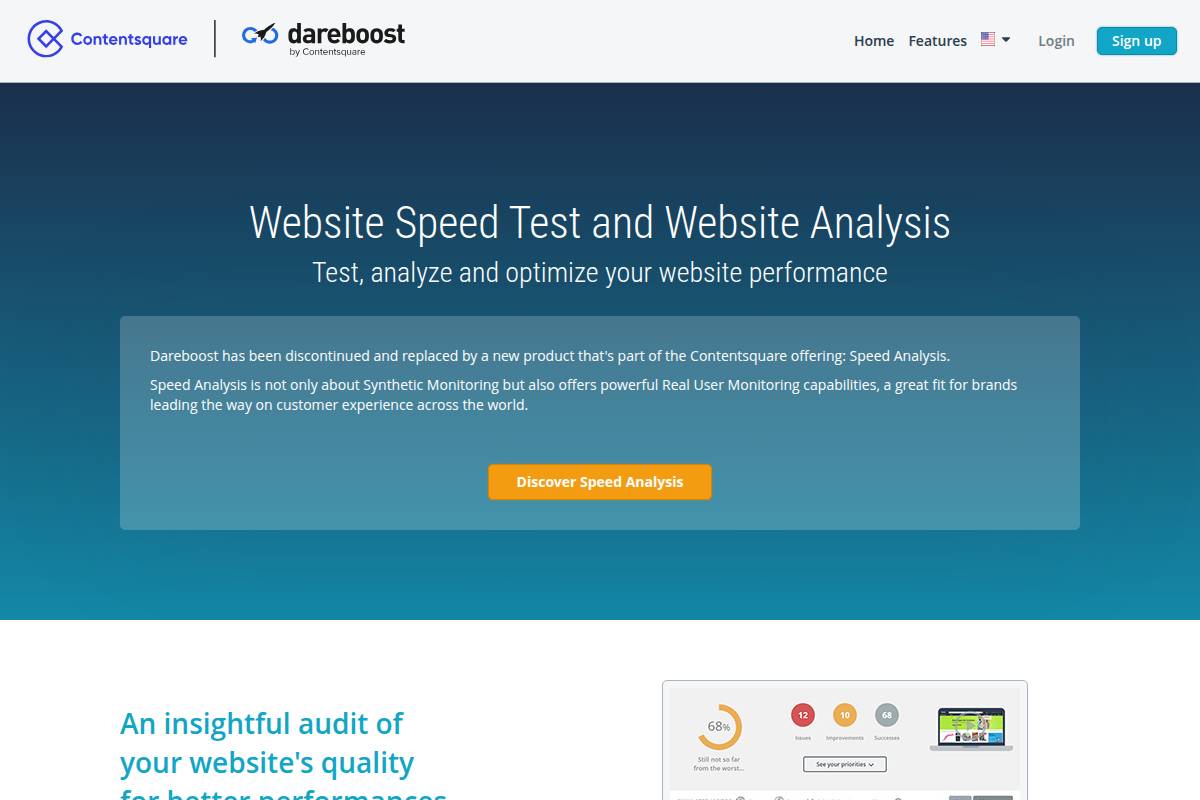
Dareboost
Overview
Dareboost is a cloud-based website performance monitoring and optimization platform tailored for digital teams. It focuses on page speed, security, and overall user experience. Global companies such as Decathlon and Renault have integrated Dareboost to consistently improve website ROI and maintain competitive page load times.
Dareboost stands out by offering sophisticated benchmarking and an emphasis on actionable insights, not just raw data. The service supports both desktop and mobile analysis, making it relevant for organizations with omnichannel strategies.
Technical Requirements
Dareboost operates entirely online, requiring no local installation or heavy technical setup. Users simply input URLs into the dashboard or configure automated tests from any location. Integrations with Slack and email allow for real-time alerts without complex configuration.
For advanced automation, Dareboost provides APIs enabling integration into CI/CD pipelines. Enterprises like Carrefour have adopted these APIs for daily performance regression monitoring during website deployments.
Competitive Positioning
In the site auditing landscape, Dareboost is often considered alongside tools like PageSpeed Insights, GTmetrix, and WebPageTest. Unlike single-metric solutions, Dareboost offers end-to-end user journey monitoring. Its ability to track competitors’ websites provides a distinct advantage for competitive intelligence.
While Google's offerings are free, Dareboost’s dynamic reporting and alert capabilities support larger organizations requiring granular, scheduled analytics—something basic tools lack.
Getting Started
Registering for Dareboost involves creating an account and verifying your email. Users gain immediate access to free tests for quick insights into site performance, with the option to schedule recurring audits.
For example, French e-commerce retailer Cdiscount used Dareboost’s onboarding to identify render-blocking scripts and quickly resolve key bottlenecks within their first week.
Key Features
- Page analysis reports: Detailed breakdowns include performance metrics like Speed Index and actionable tips, exemplified by dashboards showing wasted resources on homepages at major sites like Booking.com.
- Visual comparisons: Highlight performance differences between site revisions, as used by Allianz to monitor redesign impacts.
- Monitoring and alerts: Automated notifications on performance degradation help site admins react before customers are affected—critical for events like Black Friday.
- Security diagnostics: Checks for XSS vulnerabilities and SSL issues, supporting compliance at fintech leaders like Société Générale.
Pros
- All-in-one analysis: Combines speed, usability, and security data, reducing the need for multiple tools.
- User journey monitoring: Maps real visitor paths, aiding UX teams in troubleshooting slow or broken flows.
Cons
- Limited free test runs: The free tier restricts non-subscribers to a small number of analyses per month, which may not suit businesses needing frequent checks.
- Premium features gated: Some advanced capabilities, such as custom branded reports and third-party integrations, require paid plans.
Pricing
Dareboost offers tiered pricing starting with a free plan that includes basic monthly tests. Professional plans begin at approximately $23 per month, scaling with report frequency and API access. Large enterprises negotiating bespoke requirements, such as Groupama or Vente-Privee, typically receive customized quotes.
User Sentiment
Reviews frequently point to Dareboost’s value in actionable reporting and uptime monitoring. For instance, digital agencies like Adveris cite improved client transparency and trust through Dareboost’s shareable custom reports. Some feedback notes test limits on free accounts as a limitation for rapid prototyping.
Reference: Dareboost: Website Speed Test and Website Analysis – Free test
YSlow
Overview
YSlow is a widely known tool originally developed by Yahoo! for analysing web page performance and providing actionable recommendations. It evaluates web pages against a set of best practices to help developers optimize site speed and efficiency.
Since its release, YSlow has been used by brands such as LinkedIn and eBay to identify performance bottlenecks. As web speed remains a crucial factor for SEO and user engagement, YSlow’s foundational approach remains instructive, though its relevance has shifted with the advent of newer tools.
Technical Requirements
Installing and running YSlow requires a supported browser, as it functions primarily as an extension for Chrome, Firefox, Safari, and Opera. Notably, it does not support mobile browsers or mobile-first testing.
YSlow’s dependency on older browser extension APIs means it doesn’t always integrate smoothly with the most recent versions of supported browsers. For example, Google Chrome’s extension platform changes have occasionally resulted in compatibility issues since 2018.
Competitive Positioning
Historically, YSlow competed with tools like Google PageSpeed Insights and GTmetrix. While YSlow focuses on a rules-based evaluation, newer platforms offer more comprehensive reporting, including real mobile testing and deeper integration with modern build pipelines.
Major enterprise sites such as Shopify use multiple tools in parallel, often prioritizing Google Lighthouse for its continued updates over YSlow’s more static rule set. YSlow still provides unique historical value for “before and after” performance benchmarking.
Getting Started
To begin with YSlow, users first install it as a browser add-on, then run analyses directly from the browser’s toolbar. The interface is designed for efficiency, displaying grades and suggestions in an easy-to-navigate panel.
Early adopters at Smashing Magazine found YSlow’s onboarding process straightforward, requiring less than five minutes to install and launch their first site audit. No registration or setup account is required.
Key Features
YSlow offers a variety of features centered around rule-based performance analysis. Some areas where it stands out:
- Browser extension: Installs in browsers like Firefox and Chrome, enabling point-and-click analysis.
- 23 performance rules: Evaluates pages on 23 distinct criteria, including HTTP requests, CDN use, and compression.
- Customizable settings: Lets users adjust which rules are evaluated or weighted, tailoring the output to unique site architectures.
- Grade-based scoring: Assigns letter grades (A–F) to highlight strong and weak performance areas at a glance.
For example, PayPal’s frontend team referenced YSlow’s suggestion on optimizing image sizes to reduce average page load times by 17% in 2015.
Pros
- Free, open source: No cost and code transparency make it attractive to individual developers and small teams.
- Widely supported: Strong historical presence and broad community adoption, with usage by organizations like Mozilla and the BBC.
Cons
- No mobile support: Cannot test mobile or responsive views, limiting its usefulness for mobile-first design strategies employed by brands like Airbnb.
- Outdated in some areas: Last significant update was over five years ago, so recommendations do not always align with modern performance standards such as HTTP/2 or lazy loading. Developers from Netflix have cited the need for supplementary tools alongside YSlow.
Pricing
YSlow remains entirely free and open-source, with no premium tiers or paid add-ons. This accessibility has contributed to its widespread adoption by educators and freelance web optimizers alike.
User Sentiment
Reviews highlight YSlow’s ease of use and ability to quickly flag common web performance issues. However, some developers, including teams at The Guardian, note its lack of updates as a significant limitation for maintaining modern web standards.
Reference: YSlow - Official Open Source Project Website
SiteSpeed.io
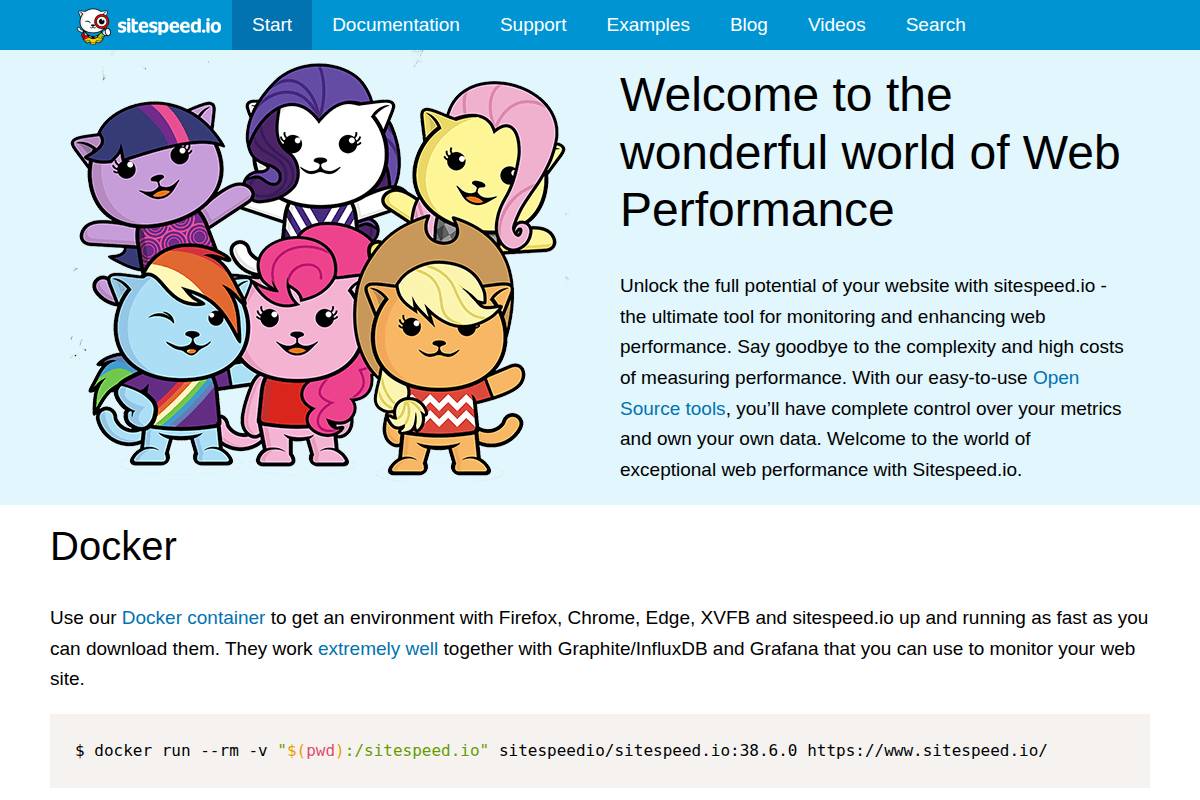
SiteSpeed.io
Overview
SiteSpeed.io is an open-source tool designed for developers to measure, analyze, and optimize website performance. It allows teams to profile web pages, record videos of page loads, and conduct in-depth audits of front-end performance – all from the command line.
This framework has gained traction with engineering teams at organizations like Wikimedia, which has used SiteSpeed.io for continuous performance regression monitoring of Wikipedia. Its appeal lies in its flexibility and focus on actionable speed metrics rather than synthetic scores.
Technical Requirements
Deploying SiteSpeed.io requires a solid foundation in command-line interfaces and Node.js. The tool runs on major platforms like macOS, Linux, and Windows but expects users to be comfortable with configuring scripts and working with Docker containers for advanced setups.
For example, developers at the Financial Times leveraged Docker-based SiteSpeed.io instances within their CI pipeline to automate real-world performance tracking on key routes. This typifies the technical setup needed for large-scale or automated deployments.
Competitive Positioning
SiteSpeed.io competes directly with tools like Lighthouse CLI and WebPageTest, but distinguishes itself through its customizable automation, video output, and ability to monitor trends over time. It is notably more developer-focused than user-friendly SaaS solutions such as SpeedCurve.
When compared side-by-side, companies appreciating full control over performance monitoring—without vendor lock-in—often gravitate toward SiteSpeed.io over proprietary cloud offerings.
Getting Started
To get started with SiteSpeed.io, you’ll need Node.js installed, and it's recommended to use npm or yarn for package management. Once installed, basic commands can analyze individual URLs, while advanced users can set up recurring tests and integrate with continuous integration platforms.
Documentation offers real-world setup guides such as integrating SiteSpeed.io with GitHub Actions for automated pull request checks, as done by Mozilla on their developer documentation sites.
Key Features
SiteSpeed.io is built around practical automation and metric collection features, supporting robust workflows for web performance engineering.
- Command-line interface: Run and script tests natively in terminal environments suitable for DevOps pipelines.
- Video and performance metrics: Captures video of page loads and correlates them to metrics like First Contentful Paint and Speed Index for real-time visibility.
- Continuous integration support: Easily connects with CI tools such as Jenkins or GitLab for scheduled, automated performance tests on each deployment.
- Customizable thresholds: Teams can set performance budgets and get builds flagged if metrics cross defined thresholds, enforcing quality gates programmatically.
Pros
- Great for developers: Native CLI workflow empowers technical teams to script and automate in line with existing engineering processes.
- Automation-friendly: Integrates tightly with CI/CD, as seen in use by Wikimedia’s engineering group for ongoing site monitoring.
Cons
- Technical setup required: Not suitable for non-developers or those unfamiliar with the command-line and continuous integration environments.
- Steep learning curve: Initial configuration and result interpretation require in-depth understanding of web performance concepts and scripting.
Pricing
SiteSpeed.io is free and open-source under an Apache 2.0 license. There is no commercial tier; users can self-host with no licensing costs. Organizations needing managed solutions may consider a third-party hosting or consulting provider, but the core tool remains cost-free.
User Sentiment
Feedback from engineering teams remains largely positive, especially among those valuing open-source, transparency, and CI/CD integration. Developers from GOV.UK and Wikimedia have praised its ability to catch regressions early and integrate seamlessly with their DevOps toolchains.
However, non-developers or those preferring UI-based tools often report a steep learning curve and initial setup challenges compared to commercial web-based platforms. Still, for developer-driven teams, SiteSpeed.io is widely respected for its depth and customizability.
Reference: Sitespeed.io
Web.dev Measure
Web.dev Measure
Overview
Web.dev Measure is an innovative web auditing tool from Google designed to help developers and site owners evaluate the performance, accessibility, best practices, and search engine optimization (SEO) of their websites. Backed by the reliability of Google, it aims to make complex website diagnostics accessible to a wider audience, from solo entrepreneurs to enterprise-level product teams.
Because Web.dev Measure is browser-based and leverages real Google technologies, it has become a popular choice for those who want a straightforward approach to site assessment without needing to install specialized software.
Technical Requirements
To access Web.dev Measure, all you need is a modern web browser and an internet connection. Since all reports are generated online and processed using Google’s infrastructure, there’s no need for any local installation or configuration. This has made it especially convenient for quick checks and remote collaboration.
For example, a digital marketing agency like Single Grain can quickly evaluate client websites on the fly during presentations or remote audits—no setup or IT intervention required. However, offline access is not supported, which could be a limitation in restricted network environments.
Competitive Positioning
Positioned as an easy entry point for web audits, Web.dev Measure stands out for its beginner-friendly interface and tight integration with Google’s Lighthouse engine. Unlike more advanced suites such as Semrush Site Audit or Screaming Frog, which offer deep crawling and extensive reporting functionalities, Web.dev Measure prioritizes simplicity and clarity in its recommendations.
Startups and small businesses often pick Web.dev Measure when they don’t need the comprehensive feature sets—and associated costs—of paid competitors. For instance, nonprofit organizations can use the free tool to maintain minimum web standards without investing in premium analytic solutions.
Getting Started
Getting started with Web.dev Measure is straightforward. Users visit the web.dev/measure page, input their website URL, and receive a detailed breakdown of their site’s current state. This process is seamless, typically taking less than a minute for a single-page audit.
Google’s guided improvement suggestions are presented in clear language, making them actionable even for those without technical backgrounds. For example, a local restaurant owner can use the tool to identify issues decreasing mobile performance, then relay those recommendations to their web developer.
Key Features
Web.dev Measure brings a set of features aimed at both ease of use and actionable insights:
- Audit tool from Google
- Covers SEO and PWA
- Guided improvement advice
- Shares Lighthouse engine
Compared with tools like GTmetrix or Pingdom, Web.dev Measure’s direct integration with Lighthouse ensures its suggestions align with current Google search and web standards. This is especially valuable for e-commerce brands—such as Warby Parker—that depend on search rankings for organic traffic.
Pros
- Beginner friendly
- Actionable reports
Many freelancers and small business owners report that Web.dev Measure’s interface makes it easy to pinpoint and fix website problems, even for those without deep web development expertise. Actionable reports support step-by-step improvements, cutting down troubleshooting time.
Cons
- Limited advanced features
- Online only
While ideal for initial audits, Web.dev Measure lacks batch project management and advanced crawl analytics found in tools like Ahrefs Site Audit. The necessity to remain online restricts use in closed or high-security environments, such as government agencies with restricted web access.
Pricing
Web.dev Measure is entirely free to use, with no usage caps or feature limitations behind a paywall. This positions it favorably for startups, non-profits, and teams with limited budgets. Enterprise users seeking more robust, customizable workflows might eventually consider complementary paid solutions for deeper insight.
User Sentiment
User reviews consistently highlight Web.dev Measure’s ease of use and clear, concise reporting. On sites like G2 and Stack Overflow, web professionals appreciate its frictionless workflow but often cite limitations in long-term tracking or collaborative features. These sentiments reflect its best-fit use case as an on-demand, web-based diagnostic tool rather than a full analytics platform.
Reference: Metrics
Recommendations
Choosing the right website performance tool depends on your role, the scale of your site, and the depth of analysis you need. Different tools offer varying levels of detail, reporting capabilities, and collaboration options. Below, we'll break down the best options for beginners, advanced users, teams, and enterprises, including real-world application scenarios and key differentiators.
Best tool for beginners: Google PageSpeed Insights, Web.dev Measure
For those new to performance optimisation, accessibility and simplicity are essential. Google PageSpeed Insights (PSI) and Web.dev Measure present clear, actionable recommendations, typically with easy-to-understand scores and improvement tips.
For example, a small e-commerce site like Brooklyn Tweed uses PSI for quick, high-level diagnostics on their product pages, allowing non-technical staff to make incremental improvements. Web.dev Measure extends these insights with broader web quality audits. Both tools require no installation and work instantly via the browser.
Best for developers/advanced users: Lighthouse, SiteSpeed.io
Experienced developers need granular data and automation capabilities. Lighthouse, built into Chrome DevTools, generates deep-dive reports on everything from accessibility to best practices and SEO. Companies developing progressive web apps, like Flipkart, use Lighthouse to ensure reliable mobile site performance.
SiteSpeed.io, which runs in Node.js environments, allows scripting, repeated test runs, and continuous integration. For instance, Wikimedia engineers employ SiteSpeed.io in CI pipelines to detect regressions during code deployment.
Best for teams/agencies: GTmetrix, Pingdom, Dareboost
Collaborative environments call for sharable reports and advanced scheduling. GTmetrix and Pingdom offer team dashboards and PDF exports, making it easier for agencies like 97th Floor to present findings to clients.
Dareboost enhances this with project tracking and competitive benchmarking. These tools are especially useful in ongoing client relationships, enabling agencies to document improvements over time and coordinate multi-member efforts.
Best for enterprises: Uptrends, WebPageTest
Large organizations manage numerous properties and require monitoring at scale. Uptrends supports multi-location synthetic and real-user monitoring, ideal for enterprises like Adidas managing global web infrastructure.
WebPageTest, used by companies such as Walmart, provides advanced scriptable tests and waterfall charts. Both platforms offer robust API access, SLAs, and integration capabilities to support the complex needs of enterprise IT teams.
FAQ
How often should I test my site’s speed?
Site speed testing should be a regular part of website maintenance. For most businesses, evaluating your site's performance monthly is a practical starting point. This helps you identify patterns and spot issues resulting from recent updates, new content, or third-party plugins.
High-traffic e-commerce businesses like Wayfair typically test their site speed weekly and after every major product release. This frequency can catch bottlenecks before they impact revenue, as even a one-second delay on product pages can reduce conversions by 7%, according to Akamai’s research.
Does page speed really impact SEO rankings?
Google has publicly confirmed that site speed is a ranking factor. Faster-loading websites tend to achieve higher visibility in search results, especially for competitive keywords. For example, Backlinko’s study analyzing 11.8 million Google search results found a clear correlation: top-performing sites loaded significantly faster on both desktop and mobile.
Google’s own Page Experience update in 2021 emphasized metrics like Largest Contentful Paint (LCP), meaning improved speed directly benefits search rankings, especially for mobile users.
Which Google pagespeed tool is best for mobile optimization?
Several Google tools assist with mobile speed analysis, but PageSpeed Insights stands out. It offers both lab data and field data from the Chrome User Experience Report, giving actionable insights like mobile-specific bottlenecks and improvement suggestions.
While Lighthouse also provides in-depth audits, it’s often used by developers for comprehensive testing, whereas businesses use PageSpeed Insights for its detailed mobile scoring. Brands like Booking.com rely on it to measure improvements to mobile performance after A/B testing.
Are premium website performance tools worth the investment?
Premium solutions such as WebPageTest (Pro features), SpeedCurve, or Pingdom offer advanced monitoring, historical benchmarking, and customized reporting that free tools typically lack.
- Pros: Real-time alerts, global test locations, integration with CI/CD pipelines, collaborative workflows, and rich waterfall visualizations.
- Cons: Monthly fees range from $15 (basic Pingdom) to $150+ (SpeedCurve for large sites), so the cost may outweigh benefits for small personal blogs.
For enterprise brands like Walmart, these tools deliver immediate ROI thanks to their potential for minimizing downtime and delivering measurable improvements to e-commerce KPIs.


